
The shift towards data-driven Human Resources (HR) means professionals must combine analytical rigour with strategic insight. Power BI offers a robust framework for integrating disparate HR datasets, automating reporting, and managing complex data by visualising patterns and tracking outcomes against business goals. In the sections below, this article explains how Power BI HR enables HR teams to track Key Performance Indicators (KPIs), design dashboards, and integrate analytics into everyday decision-making.
Understanding Power BI for HR
Modern HR generates more data than ever from payroll and recruitment to performance, wellbeing, and compliance. Consolidating data from various HR systems is essential to overcome fragmentation and create unified, actionable HR dashboards.
Yet without the right tools, this information remains fragmented and underutilised, making it crucial to use employee IDs to match records and enable seamless data integration.
What is Power BI HR?
Power BI is Microsoft’s business intelligence platform, designed to connect multiple data sources, analyse information, and present it through interactive, visual dashboards, supporting HR operations and streamlining HR reporting. In HR, it transforms workforce data into structured insights that leaders can act on.
A Power BI HR dashboard can consolidate and visualise data from payroll, recruitment, engagement surveys, performance reviews, training records, and more, including recruitment data and payroll trends as key data sources for analysis. This enables HR teams to track headcount, turnover, absenteeism, diversity, and other KPIs in a single, easy-to-navigate view, helping leaders make evidence-based decisions quickly.
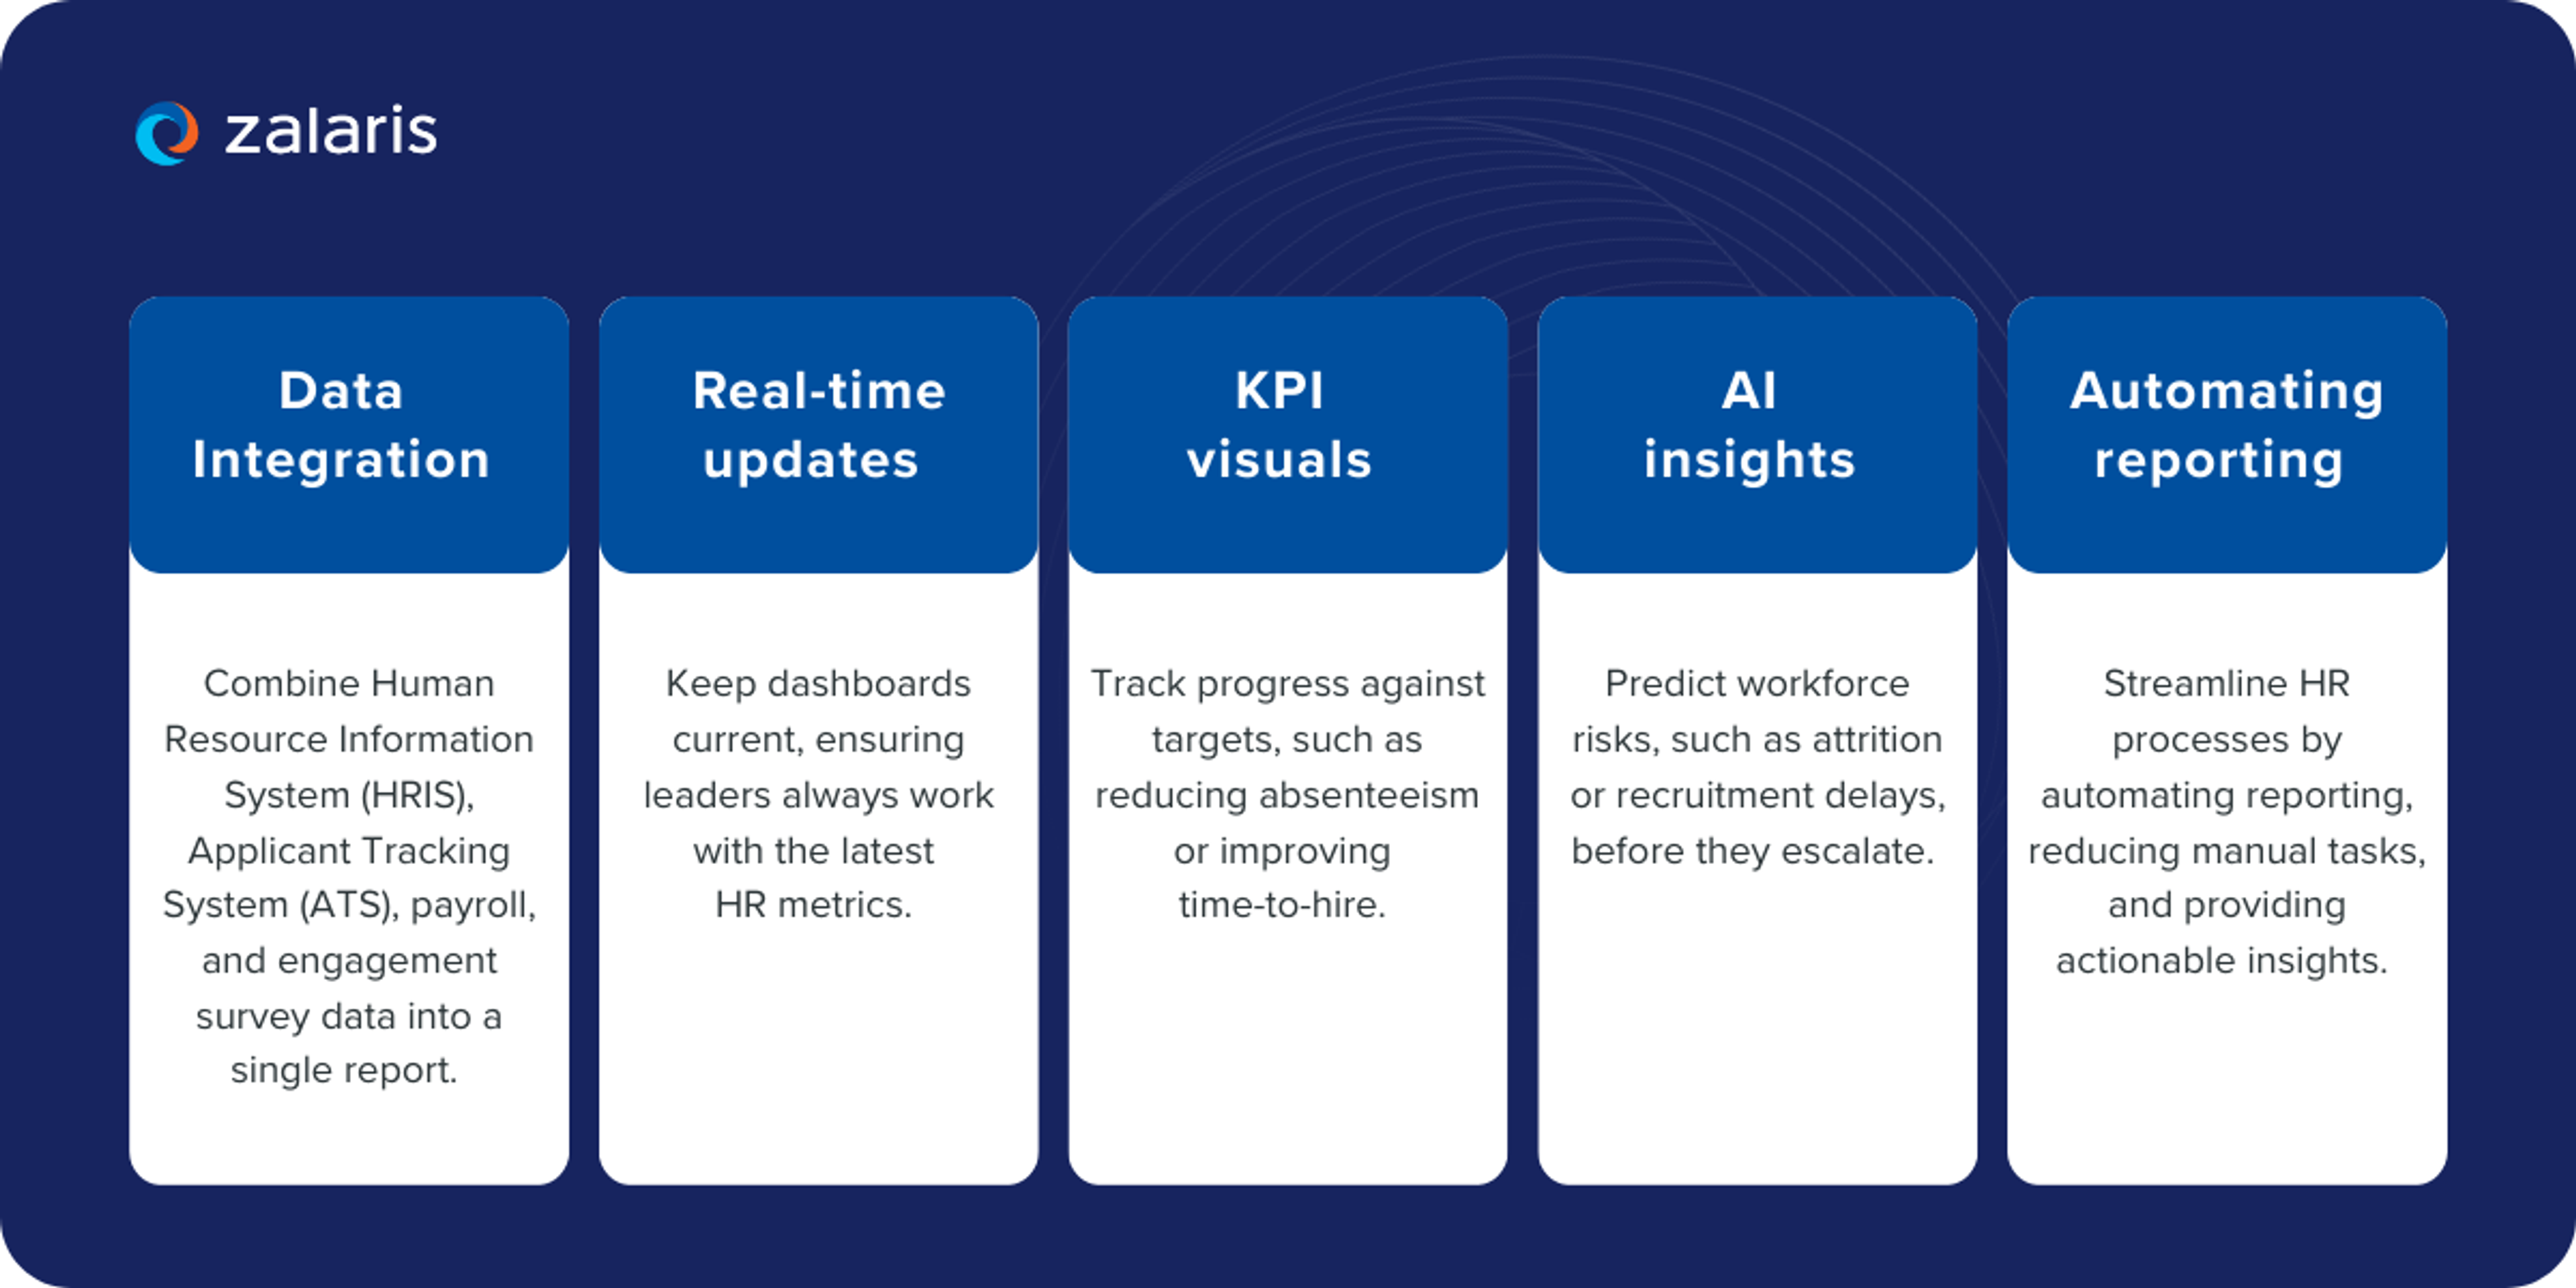
Power BI is most effective when built on accurate, standardised HR data. When payroll, time, travel, and HR records are unified into a single source of truth, HR teams can gain a comprehensive view of the workforce. Integrated with such a platform like Zalaris PeopleHub, Power BI transforms this data into clear visualisations and predictive insights, giving leaders visibility across the entire employee lifecycle.
Why HR teams benefit from data visualisation with Power BI
HR data is rarely straightforward. For example, turnover may differ across locations, job roles, or age groups. This is where visualisation becomes essential: while a static report obscures these nuances, an interactive HR dashboard in Power BI enables HR professionals to drill down by team, demographic, or other key factors to reveal meaningful insights by visualising key metrics such as headcount, attrition rates, and onboarding data to gain insights that drive better HR decisions.
Because Power BI allows thresholds, trend signals, and comparative visualisations, it helps bridge the gap between simply describing workforce data and uncovering patterns. It encourages HR to shift from descriptive reporting to predictive and outcome-oriented decision-making. By leveraging historical data, HR teams can use predictive analytics to forecast trends like turnover rates and proactively address potential risks.
According to Microsoft, organisations using HR sample datasets in Power BI can segment new hires, active employees, and leavers to uncover hidden workforce dynamics.
Power BI key features relevant to HR
The strength of Power BI lies in features that directly support HR decision-making. These capabilities help transform raw workforce data into insights that drive performance and compliance:
Our experienced data analysts specialise in building customised Power BI dashboards for HR, enabling organisations to leverage real-time analytics and support strategic decisions that improve workforce management and HR performance.
Important HR KPIs to track in Power BI
Selecting the most relevant KPIs ensures that insights are aligned with business objectives. Key metrics to include are salary distribution, average salary, and gender distribution, which provide valuable insights into compensation trends and workforce demographics. Data-driven decisions drive tangible organisational impact by aligning KPIs with business needs and improving organisational performance.
How to define actionable KPIs
Deloitte’s 2024 Global Human Capital Trends report reveals that only 3% of organisations consider themselves as highly effective at capturing the value created by their workforce. This highlights a common challenge: many HR teams struggle to turn data into meaningful insights. Power BI HR dashboards support informed decision making by providing clear visualisations and analytics that help HR leaders act on workforce data.
For example, tracking “average time-to-hire” only adds value if it is linked to operational efficiency or an improved candidate experience, as well as using turnover analysis and tracking attrition trends to identify potential issues and inform retention strategies. Power BI allows HR teams to set thresholds within KPI visuals, providing immediate signals when performance diverges from benchmarks.
Strategic HR metrics must align with organisational goals. A retail group may prioritise reducing overtime costs, while a technology firm focuses on retaining niche digital skills. By connecting HR KPIs to financial and operational data in Power BI, HR leaders can demonstrate how workforce decisions influence margin, productivity, and growth, while also supporting workforce management and employee retention.
Key takeaways:
Dashboards are only as strong as the metrics behind them. For HR leaders, choosing the right KPIs ensures that Power BI highlights trends that matter most to organisational performance and helps improve HR processes. By aligning metrics with business goals, HR can move beyond reporting activity to demonstrating measurable impact.
Core metrics every HR department should monitor
While the specific focus may vary depending on the industry, HR teams still need to identify the core metrics that matter most.
Certain HR KPIs that every department should monitor include:
- Headcount and full-time equivalent (FTE) trends.
- Absenteeism and overtime hours.
- Employee turnover rate, segmented by voluntary and involuntary exits.
- Average time-to-hire and cost-per-hire.
- Training hours per employee and learning effectiveness.
Additionally, tracking job satisfaction and employee satisfaction is crucial for understanding workforce well-being and engagement. Monitoring training programs, recruitment analytics, and recruitment trends helps HR teams measure development effectiveness, optimise hiring processes, and make informed talent acquisition decisions.
HR Dashboard and Data Management
For HR leaders navigating today's data-rich landscape, effective workforce management increasingly depends on one critical capability: transforming fragmented information into strategic intelligence. As organisations grapple with ever-expanding volumes of employee data scattered across multiple systems, the need for a unified, accessible analytics platform has become not just beneficial-it's essential. An HR analytics dashboard, powered by sophisticated solutions like Power BI, consolidates vital workforce metrics including employee performance indicators, demographic insights, and retention effectiveness into a single, dynamic command center that transforms how HR teams operate.
Through Power BI HR dashboards, your organisation can seamlessly bridge the gap between disparate data sources, converting raw workforce information into compelling, actionable intelligence that drives real business impact. These interactive platforms empower HR departments to monitor emerging workforce patterns, scrutinise performance trajectories, and evaluate the true effectiveness of retention initiatives as they unfold. By bringing key HR metrics into sharp visual focus, HR professionals gain unprecedented clarity into their workforce dynamics, enabling them to spot emerging trends before they become challenges, address operational gaps with precision, and ensure HR strategies align seamlessly with broader organisational objectives.
The capacity to drill deep into granular data points-whether examining age demographics, dissecting role-specific performance, or analysing departmental variations - provides HR teams with the analytical firepower to make informed decisions that enhance both immediate operational efficiency and long-term strategic positioning. Whether your focus is optimising resource deployment, elevating employee engagement scores, or strengthening diversity and inclusion metrics, a thoughtfully designed HR dashboard ensures that critical workforce insights remain constantly accessible to leadership teams who need them most.
Ultimately, leveraging Power BI for comprehensive HR analytics dashboard development represents more than just streamlined data analysis-it fundamentally elevates HR's strategic influence within your organisation. By transforming complex workforce data into clear, compelling intelligence that speaks directly to business outcomes, HR departments can drive meaningful organisational change while demonstrating their essential contribution to overall business success and competitive advantage.
Creating effective HR dashboards in Power BI
Raw data alone does not drive decisions. The value lies in presenting information in a way that makes patterns clear and actions obvious. Power BI enables HR leaders to build dashboards that combine KPIs, metrics, and visualisations into an integrated view of workforce performance. Modern hr reporting leverages Power BI to automate and visualise HR data in real time, using specialised dashboards such as the attrition dashboard, hr recruitment dashboard, hr payroll dashboard, and hr diversity dashboard to enhance decision-making and operational efficiency.
A good HR KPI dashboard includes a dedicated tab for analysing every area of operation within the human resources department. The HR employee dashboard is designed to analyse headcount distribution across roles, departments, and demographic characteristics. The HR recruitment dashboard tracks progress toward filling open roles and optimises the candidate sourcing process. The HR payroll dashboard visualises employee compensation data, measuring full payroll costs and allocating them to specific departments or projects. The HR attrition dashboard helps measure attrition problems, such as when departed employees are not replaced for a long time, increasing the workload per employee. The HR diversity dashboard analyses the correlation between different demographic characteristics and salary or promotions. KPI cards display essential, high-level HR metrics like Total Headcount and Average Salary.
Visualisation types for HR data
Power BI supports a wide range of visualisations, making HR data more accessible and easier to interpret. Visual data representations in an HR dashboard may include cards, line charts, bar charts, and pie/donut charts.
Stacked column charts - ideal for turnover, allowing HR to compare exits across departments or demographics to identify hotspots and to identify departments with high absenteeism for targeted intervention.
Heatmaps - effective for absenteeism trends, surfacing geographic or seasonal spikes at a glance, and can be used to identify departments with high absenteeism. Calendar heatmaps can visualise absenteeism trends by day or week, highlighting spikes and patterns.
Line charts - useful for monitoring time-to-hire and for tracking attrition rates over time, clearly illustrating changes and patterns in workforce dynamics.
KPI cards - provide executives with quick “at-a-glance” progress towards diversity or headcount targets.
HR dashboard examples & use cases
Once HR teams have selected the appropriate visualisations, these can be applied to key functional areas to turn raw data into actionable insights, overcoming complex data challenges and improving hr reporting. Every organisation faces unique workforce challenges, but the principles of data-driven HR are universal.
Data-driven HR decision-making enhances workforce planning by providing insights into employee performance and turnover rates. Data-driven insights from HR analytics can guide retention strategies, improve workplace culture, and help HR departments improve compliance with regulations and overall HR effectiveness.
By applying Power BI to specific HR scenarios, teams can uncover insights that directly improve hiring, retention, compliance, and workforce planning. Real-world use cases show how analytics translates into measurable impact:
Recruitment efficiency
A Power BI HR dashboard example could highlight bottlenecks in recruitment by visualising average time-to-hire per role, using recruitment analytics and recruitment data to provide deeper insights. If data shows delays in technical hires, HR leaders can allocate more resources or adjust sourcing strategies.
The HR recruitment dashboard is designed to track progress towards filling open roles and optimise the candidate sourcing process. Criteria such as cost-per-hire and offer acceptance rates are important for measuring recruitment efficiency. Funnel charts can visualise the candidate pipeline, helping to identify bottlenecks in the hiring process. Time to fill, the average number of days taken to fill a vacancy, is a key metric. Power BI enhances recruitment metrics analysis by tracking time-to-hire, source of hire, and candidate demographics.
Retention and turnover
Organisations using Power BI for HR can accelerate the detection of turnover risks by segmenting exits by department and tenure, using an attrition dashboard for turnover analysis and tracking attrition trends. This enables HR leaders to pinpoint areas of concern and intervene before attrition spreads.
A real-world case study using Power BI demonstrates the value of these dashboards with concrete numbers: an organisation analysed its workforce and found an overall attrition rate of 16%, with male employees, single employees, and entry-level roles experiencing the highest turnover. Employees with low performance ratings showed attrition rates as high as 84%. By leveraging historical data, the organisation applied predictive analytics to forecast future turnover and inform employee retention strategies.
The HR attrition dashboard helps measure the problem of attrition, especially when departed employees are not replaced promptly, increasing workload per employee. Employee turnover rate can be calculated as (Number of Exits / Total Employees) * 100. Power BI dashboards support predictive analytics to forecast trends in turnover, workforce planning, and engagement. Data-driven insights from HR analytics can guide retention strategies and improve workplace culture.
By visualising exits across department, tenure, and other factors, HR leaders were able to pinpoint high-risk groups and implement targeted retention strategies, translating insights directly into actionable interventions

Absenteeism management
Dashboards tracking absenteeism rates by day of week or role help identify departments with high absenteeism, enabling targeted interventions. For instance, high overtime linked with spikes in absence may signal a workload imbalance.
Absenteeism trends can also be visualised with a calendar heatmap, making it easy to spot spikes by day or week.
Diversity, equity, inclusion (DEI)
Dashboards combining demographic data with promotion rates or pay equity, as well as analysing gender distribution and salary distribution, offer actionable insights into workforce fairness. This supports compliance with regulations such as the UK Gender Pay Gap reporting requirements.
The HR diversity dashboard analyses the correlation between different demographic characteristics and salary or promotions. Tracking diversity metrics within the workforce ensures compliance with diversity goals and informs strategies for improvement. Power BI can track diversity and inclusion metrics to ensure compliance with organisational goals.
Compliance and audit readiness
With Power BI’s audit trails and reporting functions, HR can generate compliance-ready reports on working hours, training, and safety metrics. This reduces preparation time during audits and ensures accuracy.
Expert tips for actionable dashboards
When implementing Power BI, organisations benefit from:
- Limiting each dashboard to 6 - 8 visuals for clarity and ease of use.
- Providing filters for location, role, and tenure to enable tailored analysis.
- Combining leading indicators (e.g., engagement survey scores) with lagging ones (e.g., turnover).
- Aligning design with how leadership consumes data, concise visuals for executives, and granular breakdowns for HR analysts.
Getting started with Power BI in HR
Turning Power BI into a practical HR tool requires a structured approach. From identifying the right datasets to training HR analysts, implementation works best when rolled out in clear stages. The following steps help HR leaders move from experimentation to sustained impact:
- Identify core data sources: Connect HRIS, ATS, payroll, and engagement survey platforms.
- Prioritise initial KPIs: Focus on 5–6 metrics with the highest organisational impact.
- Use Power BI HR dashboard examples: Start with Microsoft’s HR sample dataset to experiment with visuals and layout.
- Pilot with one department: Test dashboards in a specific function before scaling them across the entire department.
- Invest in governance: Define data ownership, refresh cycles, and user permissions to protect integrity.
- Build internal capability: Train HR analysts on Power BI features and encourage data literacy across HR teams.
Unlocking HR insights with Power BI
Power BI HR transforms scattered workforce data into meaningful insights. By consolidating information across systems, visualising trends, and tracking KPIs against business outcomes, HR professionals gain the tools to make faster, evidence-based decisions. From recruitment efficiency to diversity reporting, dashboards transform data into actionable insights.
Zalaris delivers that foundation with People Analytics, a PeopleHub capability powered by Microsoft Power BI. It unifies HR, payroll, time and travel data, and integrates across many third-party tools, including SAP.
Organisations receive role-based dashboards, predictive lifecycle analytics, what-if scenario modelling, DEI and total rewards analytics, plus automated compliance monitoring, enabling leadership to make better-informed decisions and surface risks early.
Furthermore, this analytics layer can be seamlessly integrated with our managed HR and payroll services, giving your organisation trustworthy, consolidated data. Contact our team today to discover how Power BI can enhance HR decision-making.
FAQ

Elliot Raba
Enterprise Sales Executive
Elliot is a dynamic and results-driven Enterprise Sales Executive at Zalaris UK&I, where he excels in crafting innovative solutions that address the unique needs of his clients. With a keen understanding of the intricacies of enterprise level operations, Elliot leverages his extensive industry knowledge to drive business growth and foster lasting partnerships.